PISA 2025: Spain falls further than its peers, the decline is global and points to a deterioration in students’ attention
Lucas Gortazar
8 Sep, 2026
Key ideas
→ The decline is concentrated where the Spanish system used to be strongest, and the fall in the top quartile across the OECD is the most striking result globally. Spain loses 45 points per decade in reading compared with 27 for the OECD, and falls back above all at both ends of the socio-economic scale: the highest socio-economic quartile falls much further, and Spain is one of only two countries in the world where the share of high-achieving students from disadvantaged backgrounds shrinks in both reading and mathematics at the same time. The larger drop in results for the top quartile, in Spain and globally, is an unprecedented finding after a quarter of a century of PISA.
→ The deterioration in students’ ability to sustain attention is clear and explains part of the decline, something that may be aggravated by the way students now use generative AI. While written comprehension deteriorates much less with short texts, students fail on long texts and rush through questions instead of working on them. Behind this lies a social change: digital leisure is shifting towards more passive activities, parents ask fewer questions and absenteeism is rising. The way 15-year-old students currently use generative AI —summarising and writing texts— is associated with poorer results, and much less so when it is used for thinking and research; and it is students from the highest socio-economic backgrounds, precisely those who have fallen furthest, who use it most.
→ Neither the test itself, nor problems in lower secondary education (ESO), nor immigration, nor mobile phones in classrooms explain much of the decline. The OECD’s technical checks, more robust and thorough than usual, show that the test remained the same and that students did not behave differently when taking it; that the effect of increased immigration has been small; that mobile phone bans in classrooms already cover half of OECD students without their expansion being reflected in results; and that some of the problems in secondary education could already be seen coming in primary education in the latest editions of PIRLS.
1. Spain falls, at both the top and the bottom
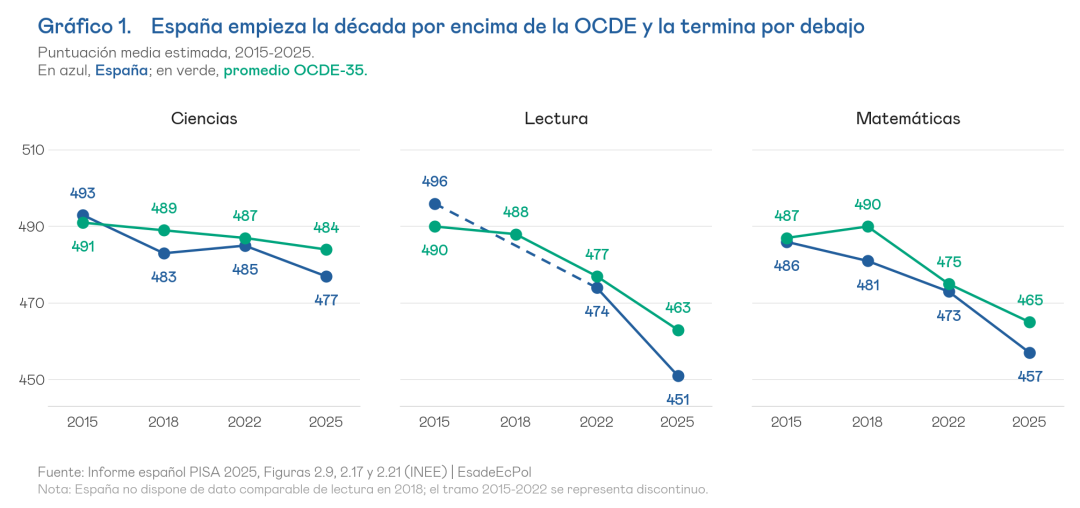
Spain falls further than its peers and is one of only two countries in the world where the share of high-performing students from disadvantaged backgrounds shrinks in both reading and mathematics at the same time. Its decline between 2015 and 2025 is −45 points in reading, −29 in mathematics and −16 in science, compared with −27, −22 and −7 for the comparable average. The decline is international —reading falls in three out of four systems with comparable data, by 25 points on average across the OECD between 2018 and 2025—, but Spain amplifies it. Between 2022 and 2025, the share of high-performing students fell among both advantaged and disadvantaged students, and in both reading and mathematics. The former happens in 32 systems in reading and 18 in mathematics; the latter does not. According to the OECD, the decline among the best advantaged students in mathematics is a downward trend that began in 2015, not with the pandemic.
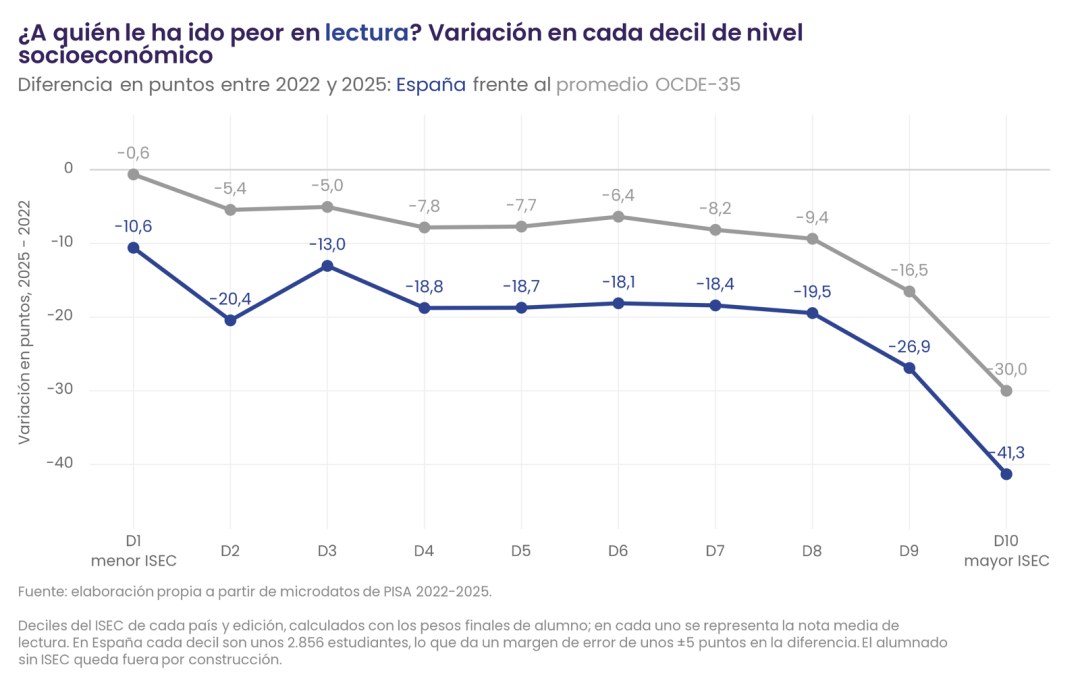
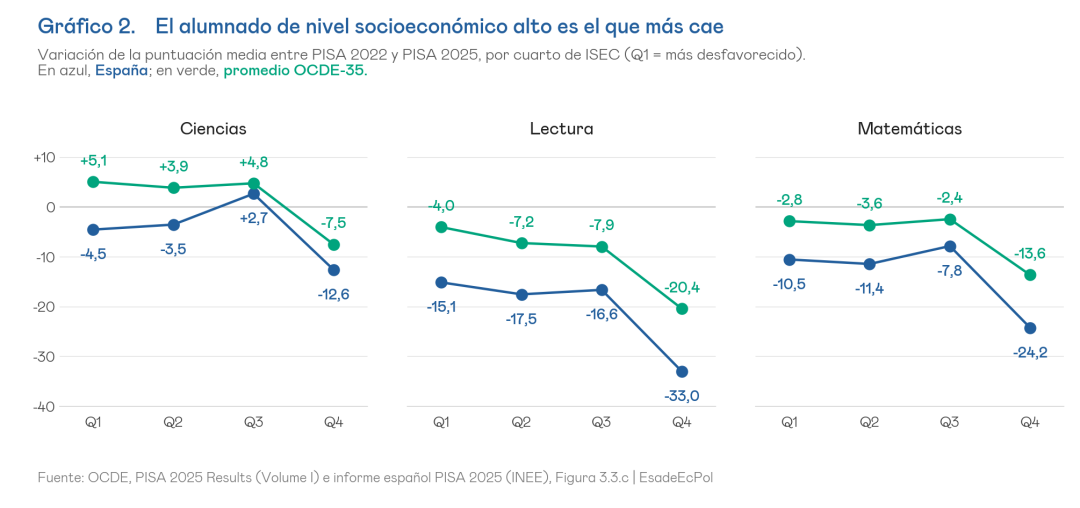
Internationally, the report’s most important finding is that results among students from the highest socio-economic backgrounds are falling two to three times as much as those of other students, something unprecedented so far this century. Reading results fall by 33 points in Spain —and 20 points on the OECD average—, double the decline in the other quartiles, which fall back by between 15 and 17 points in Spain and between 4 and 8 points in the OECD. Something similar happens in mathematics and science. This implies that something happened to students from high socio-economic backgrounds in the richest countries between 2022 and 2025. The OECD specifies that this decline is concentrated among students from high socio-economic backgrounds but with rather low results.
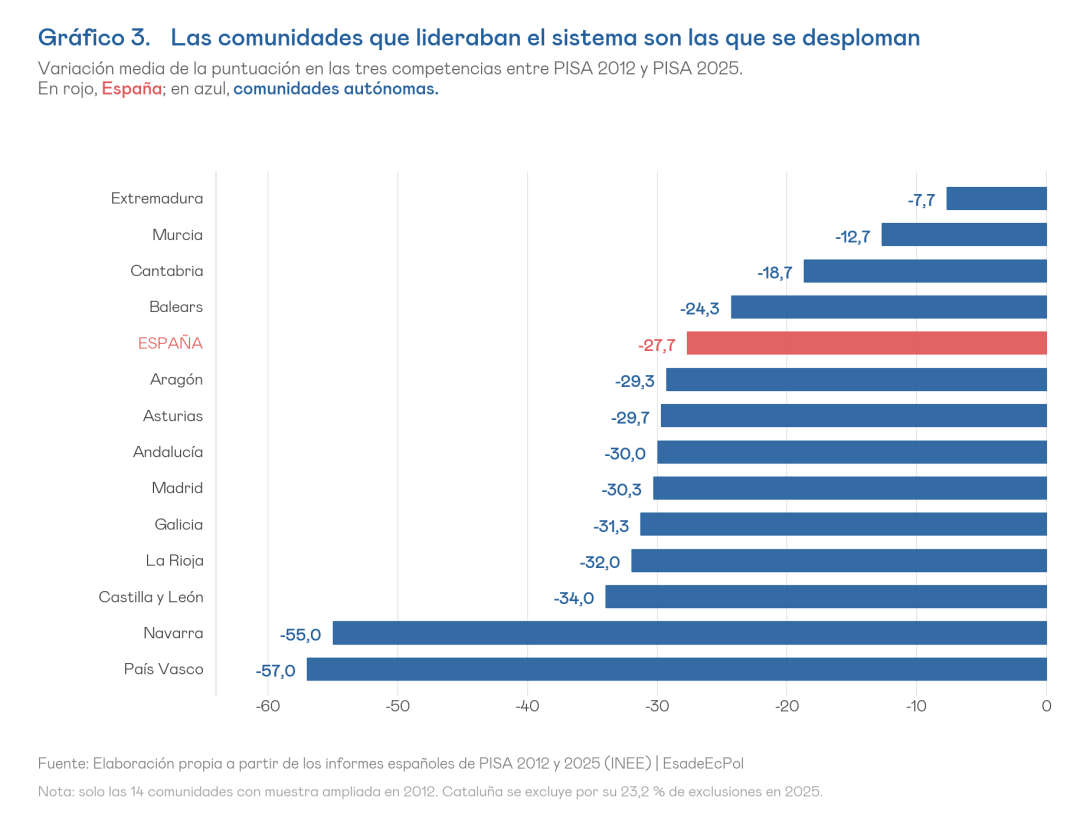
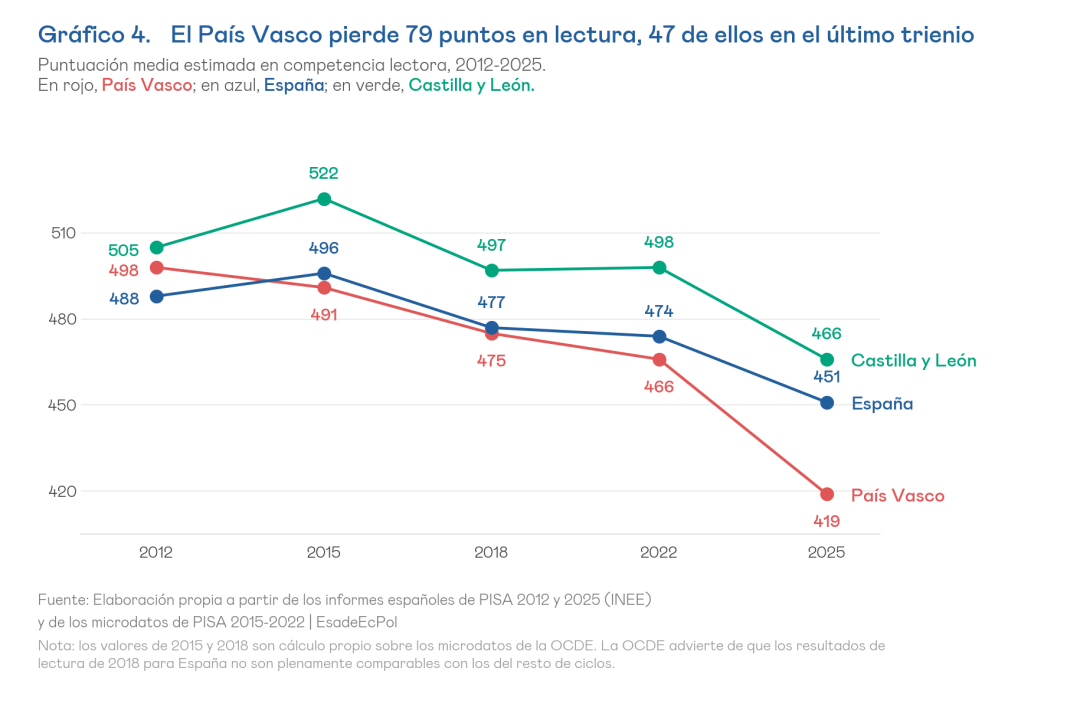
The regional map repeats the pattern, with a negative and unprecedented result in the Basque Country. The regions that led the system in 2012 are the ones collapsing: the Basque Country loses 57 points on average across the three domains and Navarre 55, with cumulative falls since then. The Basque Country now ranks as the autonomous community with the weakest reading proficiency, at 419 points, ahead only of Ceuta and Melilla. In any case, the declines have also been significant in the other northern regions between 2022 and 2025. By contrast, southern regions such as Extremadura, Murcia and Castilla-La Mancha, which started from lower levels, are holding up better.
2. Reading attention is falling and this appears to be dragging down results
The OECD’s item-by-item analysis identifies where students struggle with reading comprehension and, therefore, where things are getting worse. The drop in performance is associated with text length: items based on 400-word texts show larger falls in correct answers than short texts, of fewer than 200 words, or medium-length ones, of 200 to 399; while performance falls equally whether the question asks students to locate a piece of information or to critically evaluate the text. Furthermore, the question format points in a consistent direction, because between 2022 and 2025 answers improved slightly in open-response items and continued to fall in multiple-choice items: students answer quickly and wrongly precisely where the question allows them to get away without effort. All of this may be closely connected to the reading crisis that Western societies have been experiencing over the last decade.
Students are abandoning the last questions of the test less often, and instead rushing through intermediate questions more quickly. Items that nobody reaches at the end of the test fall by two points, while quick and incorrect answers rise by four, to 9%, which suggests that this is not a problem of lack of time or fatigue: it is a lack of patience and attention. The OECD notes, without quantifying it, that unreached items are not penalised whereas quick wrong answers are scored as errors. This twofold change in behaviour has a negative impact on results.
3. Less digital leisure, but more social media, and fewer adults around
The data show that teenagers spend less time in front of a screen outside the classroom, but distribute it less well. Globally, between 2022 and 2025 digital leisure outside school has decreased, and it is the heaviest users who cut back the most, which is undoubtedly good news. However, time spent on social media is rising among students who use them for more than an hour a day and, at the same time, the informational and creative use of smartphones is falling.
Three other indicators move around this reshuffling. Globally, 28% of students say their classmates are distracted by devices in most science lessons, and this distraction is associated with lower perseverance in more than 90% of systems. The share of students who say their parents ask them what they did at school has fallen. Finally, the bond between students and school is weakening: absenteeism has grown, and missing a whole day in the two weeks before the test has risen by three points.
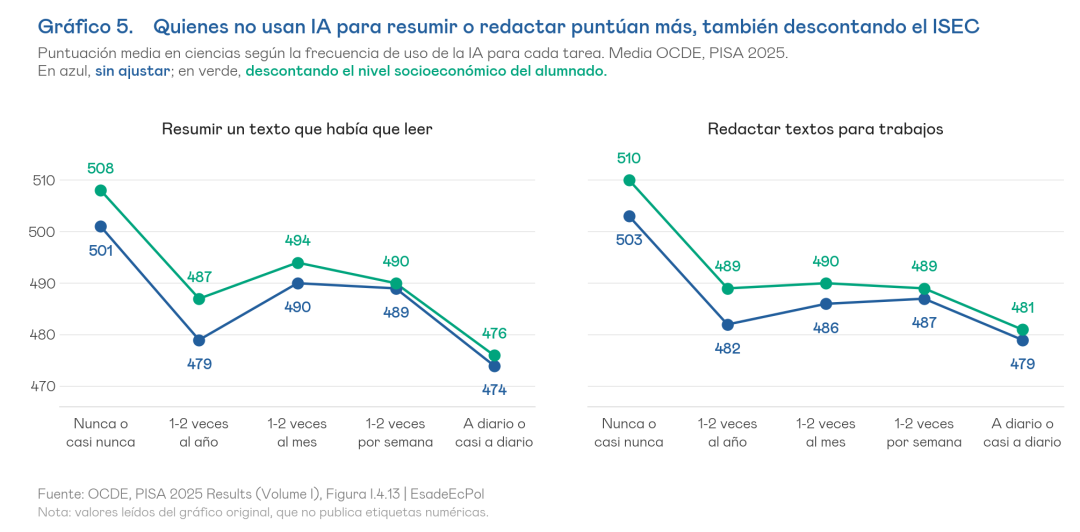
On top of all this comes a component that has only existed since late 2022, the use of generative AI, which could explain the sharp fall in results among students from high socio-economic backgrounds. In 2025 an overwhelming majority of students already use chatbots for their schoolwork. However, for tasks involving summarising and writing texts —the two tasks that school aims to teach—, those who do not use them score higher than those who do, controlling for socio-economic status; for reflection and research tasks, this relationship is less clear. This should lead us to insist on the idea of using this technology under a principle of adaptive pedagogy, with safeguards that preserve students’ cognitive effort. Given that the most frequent users come from advantaged backgrounds, the spread and use of AI in secondary education is the most plausible hypothesis to explain the larger fall in results among students from high socio-economic backgrounds observed in 2025.
4. What does not appear to be so relevant
PISA 2025 does not cause more fatigue than previous editions, and the change in students’ response strategies is not an artefact of the test, so blaming the messenger does not get us very far. The OECD unusually deploys several checks to rule out that the test’s own features conditioned the outcome by causing “test fatigue”. PISA booklets are assigned at random, which makes it possible to test several hypotheses: the decline is even larger among those who took reading in the first hour of the test than among those who took it in the second; the rotation of science blocks shows fatigue, but that fatigue does not distinguish countries that fall from those that do not; and automatic responses to the questionnaire —ticking the same option across an entire block, including questions that contradict each other— are less frequent in 2025 than in 2018. All this shows that students did not reach the end of the test in worse shape: they started it in worse shape. It should be noted, however, that the OECD itself considers sustaining attention to be part of what PISA defines as reading.
The larger decline, in Spain too, does not seem to be solely a problem of secondary education. The differences that PIRLS recorded between 2016 and 2021 already anticipated those that PISA records between 2022 and 2025 in many countries, including Spain, as there is a cross-country correlation between the two declines. This would imply that singling out lower secondary education (ESO) in the Spanish case may have less mileage than is commonly suggested.
Bans on mobile phones in schools are advancing, but banning phones does not seem to be the decisive factor, because that debate is already settled. The share of students in OECD schools that do not allow them rose from 34% to 50% between 2022 and 2025 —in Spain it already covers 86% of students—, and those schools report less distraction in class, but the expansion of bans does not correlate with changes in performance in any system. It is no longer about legislating the rule, but about implementing it well, as the evidence shows, and moving on to address what happens outside school and the use of devices.
The immigrant student population in Spain has grown faster than in the OECD and now exceeds 20%, but its impact on the decline in results is small. According to our own estimate, applying the composition calculation used by the OECD, this change would explain around 8% of the fall in reading and 25% of the fall in science in Spain. It therefore contributes slightly, but it is not the driver of the decline, especially in reading and mathematics, which is where results have fallen the most.
Sources. OECD, PISA 2025 Results (Volume I): Future-Ready Students; and Spanish PISA reports for 2012, 2022 and 2025 (INEE). The 2012 regional data correspond to the fourteen autonomous communities with an extended sample in that edition.
Methodological note. Catalonia is excluded from the 2025 comparisons because of its 23.2% exclusion rate, following the report’s own warning; data for the Region of Murcia are used with caution for the same reason (12.7%). Regional variations are differences between published averages and do not include significance testing. The estimate of the effect of migrant composition is our own: Spain is not included in the OECD-29 average with which the international report carries out that exercise.