An X-ray of residential rental housing owned by individuals in Spain
Jorge Galindo
8 May, 2026
The public debate on rental housing in Spain is dominated by two basic questions: what the homes are used for when they are not used by their owners as their main residence (second home, empty home, residential rental, tourist rental, other uses); and how many each owner has. Both are discussed on two different levels that should be kept analytically separate, as their nature and implications differ. On the level of the market: how much effective supply of rental housing there is for the households that need it, and whether the structure of that supply has features that affect how competitively it works. And on the level of ownership: how property wealth beyond the main residence is distributed across households.
Both questions tend to be discussed with broad categories, without granularity, in public debate and in politics. A binary classification such as “small landlord / multi-landlord” lumps together situations we would probably want to distinguish, such as a household with two residential homes let out and another with ten or more, and makes it impossible to see what fraction of the market is really concentrated in few hands. The Law 12/2023 on the right to housing uses a large-holder threshold of ten urban properties for residential use, a threshold that the autonomous communities can lower to five in areas declared as stressed residential markets. The threshold counts residential properties owned, whether or not they are let: a household with eleven residential homes of which only three are on the rental market is also a large holder. The law’s own preamble frames this threshold with an instrumental purpose: to identify the actors with the greatest capacity to influence the market.
The active political debate has also begun to put pressure on the wealth dimension: a Catalan proposal currently going through parliament de facto introduces a cap on accumulation by private individuals in stressed areas, and the debate on explicit wealth thresholds for individuals has even been raised in parliament, without sufficient consensus.
The recent report by the Ministry of Social Rights, Consumer Affairs and 2030 Agenda with the IFS-CSIC (Gil, Villas, García-Duch & Lebrusán, 2026), entitled Un mercado dominado por multiarrendadores(A market dominated by multi-landlords), opts for an even more demanding binary classification: it defines a multi-landlord as a holder of two or more rented homes, and its headline states that “60% of the rental stock is in the hands of multi-landlords”. The rationale given by the report itself is to contrast market reality with the public image of the “small landlord with a single rented home”, apparently combining market-related and ownership-related motivations. Ángel Martínez Jorge responded to this report by offering precisely the granularity in the distribution that the original work did not provide.
Along these lines, even before questioning the measures in place or proposed from a public policy design perspective, it is essential to anchor this granular description of the two factual questions (use and distribution), and particularly the second. Without it, we will not be able to locate and frame the debate precisely. How many homes owned by households that do not live in them are devoted to each type of rental? Who owns those homes, and how many do they own? This text answers these questions with a detailed statistical analysis of the microdata of the IEF-AEAT Household Panel 2016-2023, a source thanks to which this type of analysis is feasible in Spain for the first time (see the section Comparison with other similar exercises below). We do so with the aim of shedding light on aspects that until now have remained in the shadows or obscured by broader categories. First, what non-main homes are used for and how this evolves over time, distinguishing what enters the rental market (residential, tourist, other uses) from what remains outside it (second home, empty or lent without being declared). Second, how ownership is distributed in residential rentals among landlord households, nationally, by autonomous community and for some cities with a sufficient sample in the panel. The conclusion returns to the distinction between the two levels (market and ownership) to discuss what the data say about each.
What is really inside “rental”
The term “rental” covers very different things: contracts with business tenants (self-employed people or companies renting premises, warehouses, storage rooms or other properties typically used for a business activity), contracts between relatives (usually at below-market prices), tourist rentals, seasonal rentals and main-residence rentals. What we do in this report is isolate these categories based on how rentals are declared for personal income tax (IRPF), thanks to painstaking, ad hoc work with the Household Panel of the Institute for Fiscal Studies (described in the methodological note). We apply two conceptual filters. First, we discard properties let to businesses and to close relatives: when the tenant is a business, the possible uses are clearly separate from the residential alternative; when it is a close relative, prices are clearly separate from market prices. Second, by construction we discard the homes that owner households use as their main residence.
This approach and this source allow us to provide a highly detailed picture of the most important part of the market: the part owned by individuals. The analytical cost is leaving out homes owned by legal entities (companies, funds, SOCIMIs [Spanish REITs] and similar vehicles), which according to the Bank of Spain account for around ≈8% of the private rental market, as well as the public or social housing stock.
What remains after the filters is the subset of homes that are already used for residential purposes or that could plausibly be used for long-term residential rental. Within it, we distinguish five categories based on the signals in the Panel:
- Residential rental. A combination of declared income from real estate capital, application of the reduction for letting a main residence, and a tenant who is an individual and not a relative.
- Other types of rental between individuals. Other letting operations between unrelated individuals that do not fit into the previous category: identified by the small number of days let and the nature of the income.
- Second home. The property that the income tax return reports as available to the owner, in addition to their main residence, with no rental or formal assignment. One per household.
- Third or subsequent homes, empty or undeclared. A residual category that we cannot delimit clearly with the available data: third and subsequent homes not declared as such, homes temporarily lent to relatives without a formal contract, empty or semi-empty homes, or homes with no declared use at all. It is a heterogeneous catch-all, and we treat it as such.
The aggregate picture of the non-main housing stock in 2023 makes the hierarchy clear: what we consider second homes (47.8%) and empty homes or homes lent without being declared (27.6%) add up to more than three quarters of the non-main stock, while residential rentals account for 20.9% and the rest (3.9%) is a small fraction.
Rentals have been growing as a share of the total, gaining ground on housing that is not mobilised for that purpose. The rest of the non-main stock considered in this analysis (around 75%) remains outside the rental market, most of it being what we have defined as second homes. The trend of the other components has been downwards, which fits with the increased demand from households, tourists and non-residents not met by new-build supply. The territorial distribution will be particularly relevant for analysing this component, as having a second home or a home of undetermined use in an area of high household demand, of high tourist demand, of both, or of neither, are very different things. We will come to this in the second part of the text.

For now, we turn our focus to residential rentals owned by individuals that are not let to a relative and that are presumably governed by a long-term contract.
How ownership of residential rental housing is distributed
“How concentrated is residential rental?” allows for two different but complementary starting points. We can look at what is let (the stock of rented homes, divided according to the size of the owner) or we can look at who lets and count landlord households. We work with the household (not the individual) because it is the natural unit for holding housing, income and wealth: it adds up what two spouses may hold separately and prevents a married couple with three jointly owned flats from being counted as two small landlords.
Each lens answers a different question. The housing stock lens answers “what fraction of the rented stock is in the hands of households with several properties?”, which is useful when thinking about price policy for the market as a whole. The landlord household lens answers “what fraction of households with properties in residential rental have more than one, two, five or ten in their hands?”, which is useful for taxation or administrative registers. The first speaks of the market and the second speaks of wealth.
The following chart overlays the two distributions for 2023.
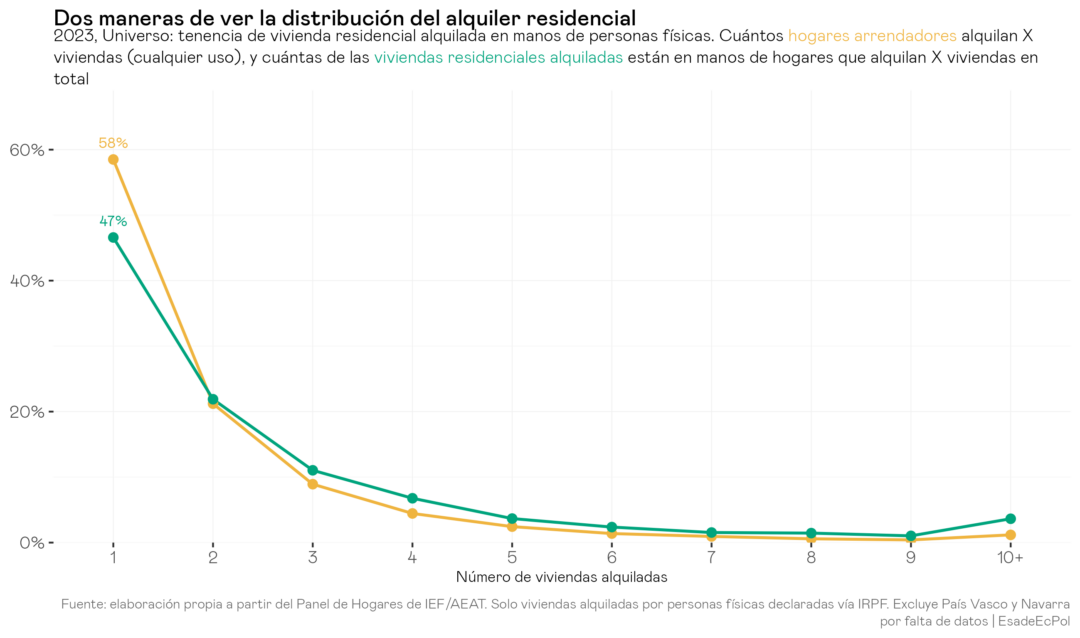
The two lines are similar but do not coincide. The stock lens (green) will always be more weighted to the right than the household lens (yellow): each home counts as one observation, so a household with five flats let as residential rentals contributes five units to the stock but only one to the household count. A simplified example makes this clear. Imagine we have ten residential landlord households: nine let one home and one lets five. Under the household lens (denominator: households), 9 out of 10 are landlords with one home (90%) and only 1 in 10 (10%) has five. Under the stock lens (denominator: homes), there are 14 homes in total: 9 are provided by the first group (64%) and 5 by the single large household (36%). The set of households with many homes is the same in both cases, but the relative weight changes with the denominator. That is the mechanism by which the green line (stock) is always further to the right than the yellow one (households).
How the stock of homes let as residential rentals is distributed
The first view therefore answers: of all homes in residential rental owned by individuals, how many belong to landlord households with many and how many to landlord households with just one?

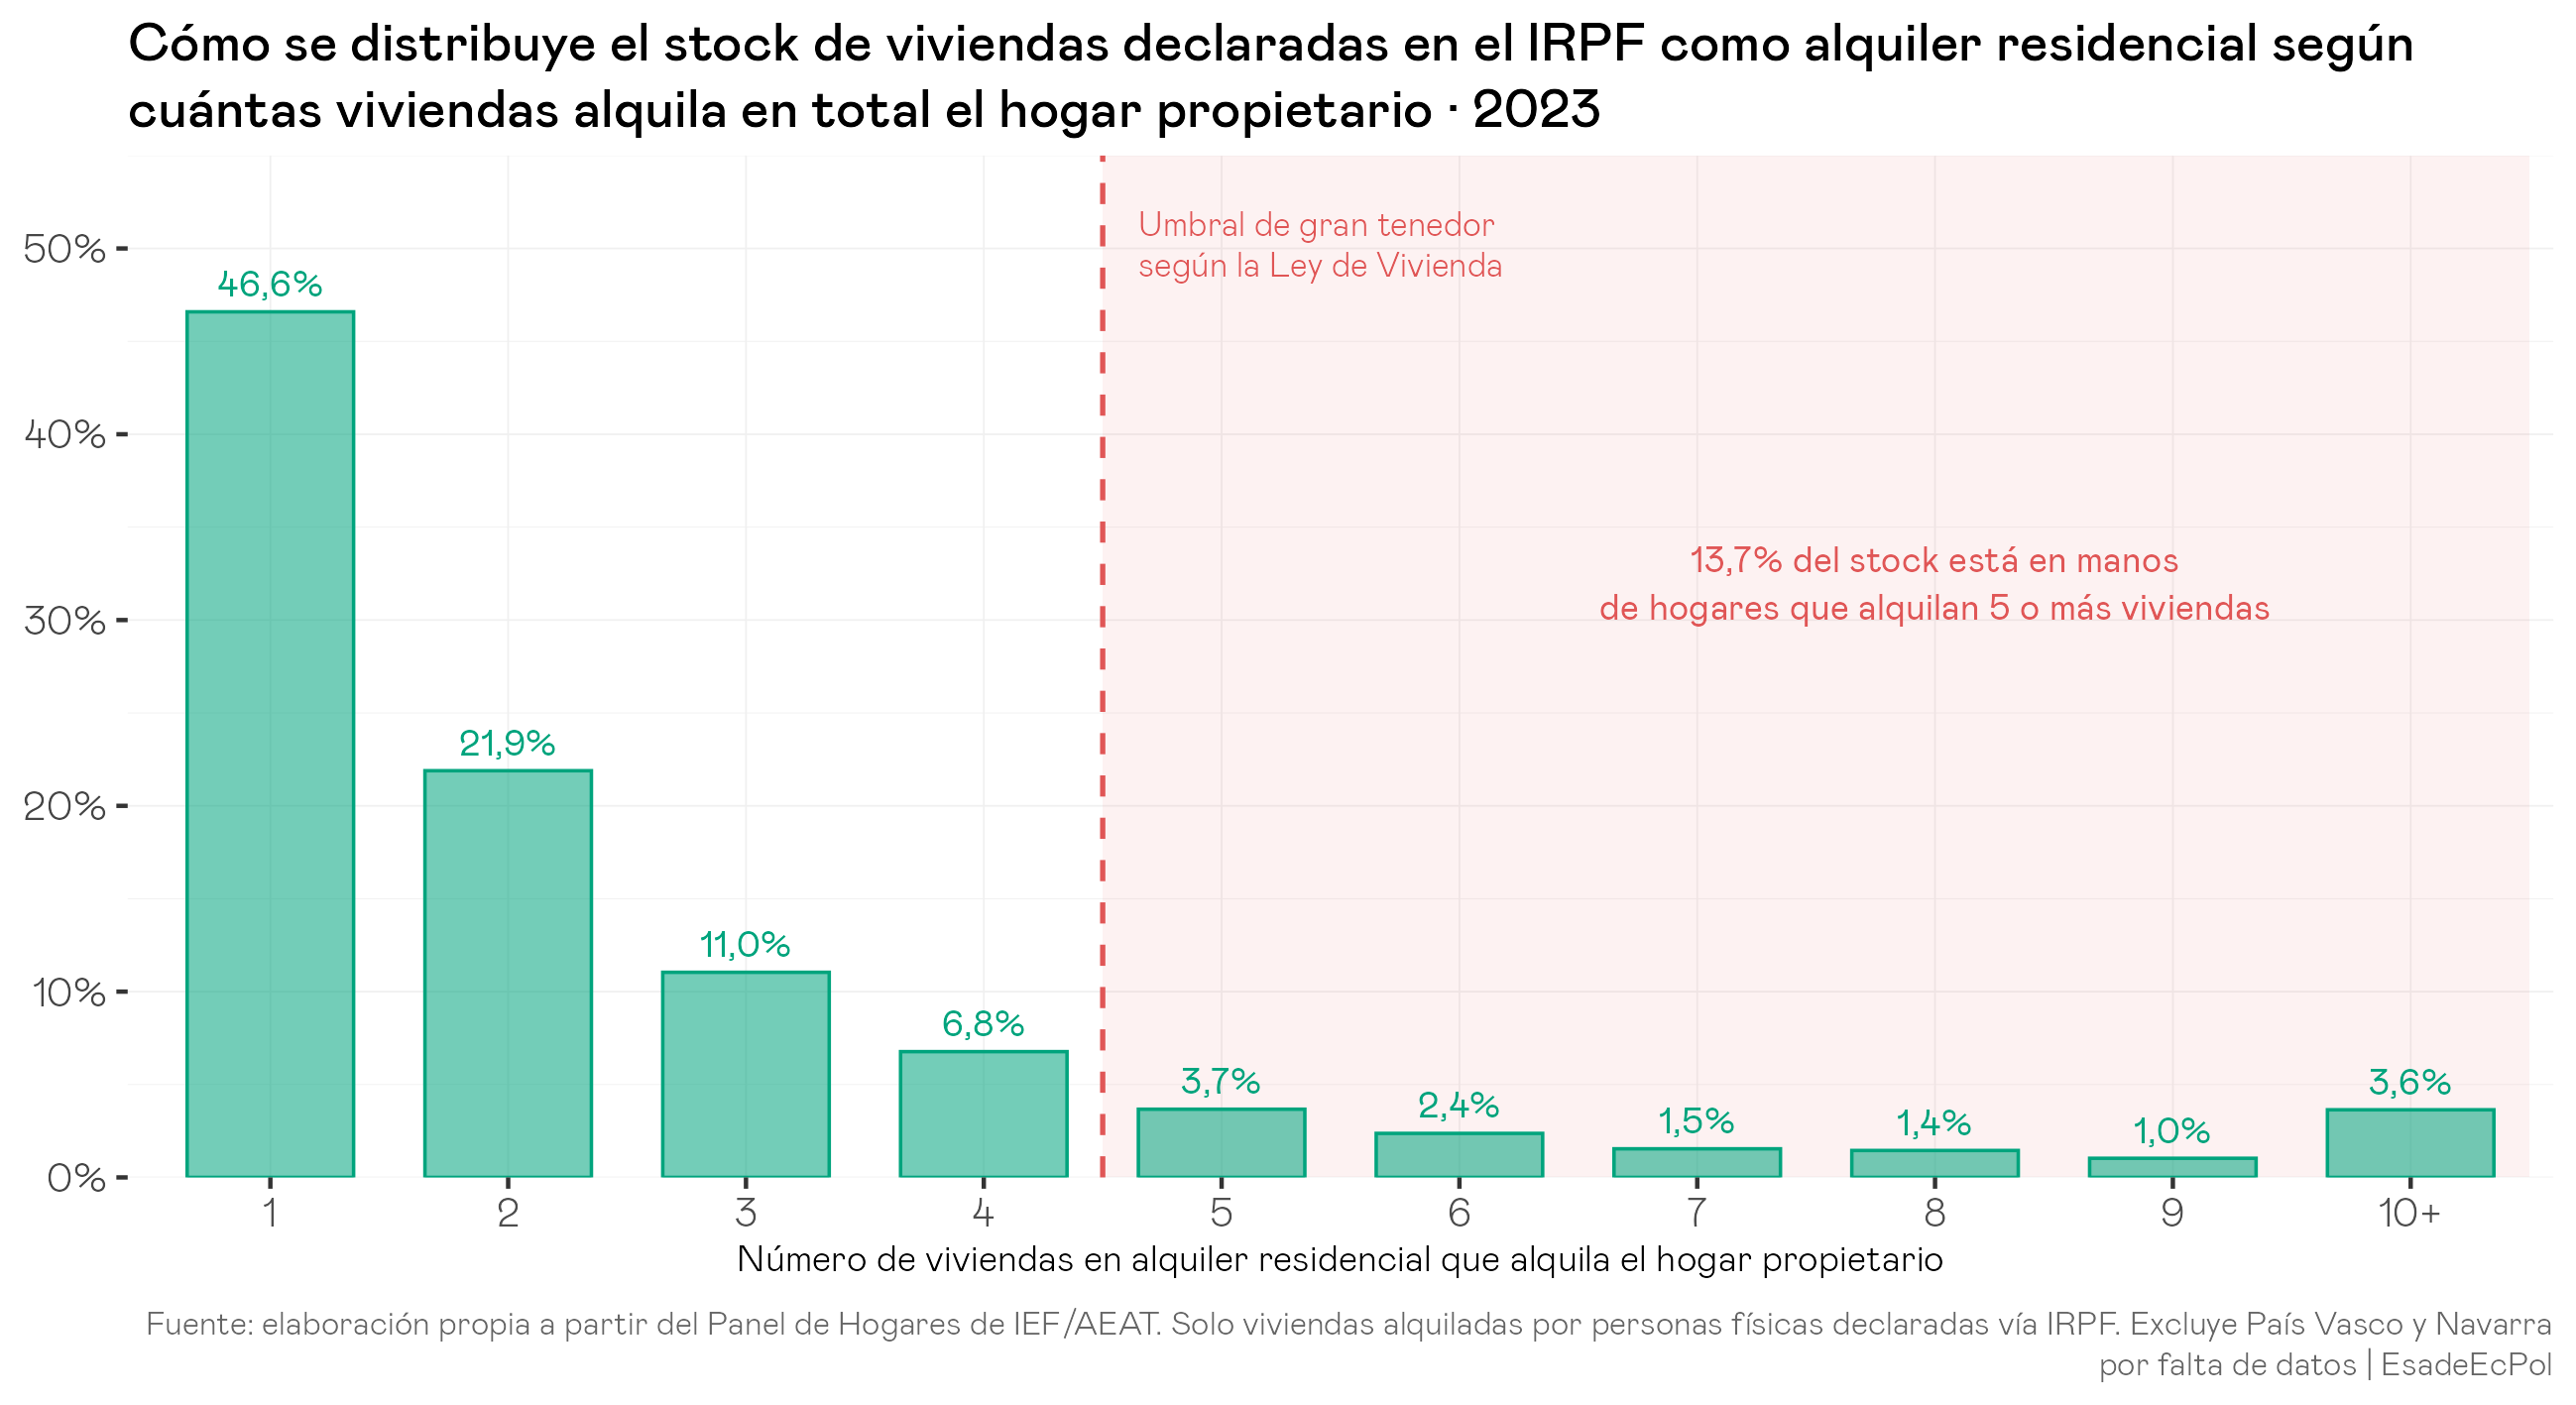
46.6% of the stock let as main residences and owned by individuals is in households that let a single residential home. Here we introduce, as an analytical addition, two further cut-offs, the ones Law 12/2023 uses in its definition of a large holder: five or more homes (the threshold applicable in areas declared as stressed residential markets) and ten or more (the default threshold outside those areas). At the first cut-off, the stock in the hands of households with five or more residential homes let is 13.7%; at the second, that of households with ten or more, just 3.6%.
This reading should be qualified: Law 12/2023 counts residential properties owned (let or not), whereas here we are counting only those actually let as residential rentals. This means that some households below our thresholds could meet the actual legal threshold (for example, a household with three rented homes and seven empty ones would be a large holder at national level but appears in our count only in the group of three). We use the cut-offs with an analytical, not normative, intent: they imply no judgement on our part as to whether those thresholds describe significant market concentration or a point at which it makes sense to discourage accumulation; they simply use the legal anchors in force to frame the reading.
This distribution has barely moved in seven years. The following chart compares 2016 and 2023.

The share of the stock in the hands of households with a single rented home falls from 49.1% to 46.6%; the share held by households with five or more rises from 13.3% to 13.7%. The movements are at the lower end (specifically, among households with one, two and three rented homes) and are consistent with a pattern in which some landlord households that already had one residential home let have added one more. The weight of households with many homes barely moves.
The household lens
The second view counts residential landlord households: how many let just one home and how many let many?

59% of residential landlord households let just one home; 6.9% let five or more in total (any use). The contrast with the 13.7% of the stock is informative: households with many homes are a tiny minority in the distribution of households, but they concentrate a larger fraction of the stock. Both figures describe the same reality: a retail market in which the few large households weigh more as a fraction of the stock than as a fraction of holders.
Looking at it through the household lens matters because, as we said at the beginning, the stock lens mechanically inflates the weight of large households (each of their homes counts once), so taking the household lens complements and qualifies the picture.
Concentration: a more demanding test
Distributions by number of homes are intuitive but do not summarise concentration in a single figure. The Lorenz curve does: on the horizontal axis it places landlord households ordered from smallest to largest holdings, and on the vertical axis the cumulative percentage of homes they concentrate. If homes were distributed perfectly equally (each household with the same amount), the curve would coincide with the diagonal of the chart. The further it departs from the diagonal, the more concentrated the holdings are. The Gini index summarises that gap in a single number between 0 (perfect equality) and 1 (a single agent owns everything).
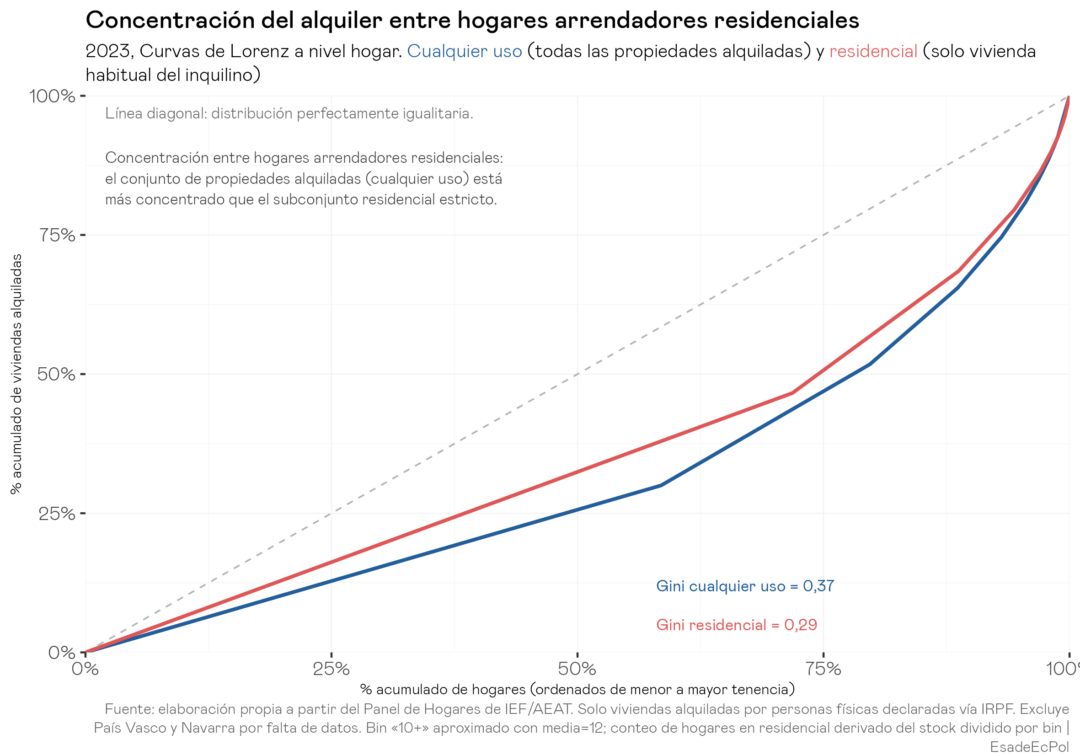
We compare the concentration of residential rentals across households with that of the full set of rented properties (any use) held by those same households. The residential curve is closer to the diagonal (the Gini is lower) because some of the households with many rented properties have few residential homes but many non-residential ones. When filtering strictly for main-residence use, the subset comes out less concentrated than the aggregate.
This nuance should be refined, because the two curves do not diverge evenly along the axis. They largely coincide at the extremes (small households are equally unconcentrated under both measures, and the largest households under both measures approach the same concentration ceiling) and the gap is concentrated around the median: the space in which the profile of a medium-sized landlord with a portfolio of diversified usesappears, households that combine one or two residential homes with several rented premises, warehouses or storage rooms. In aggregate they look like large holders; when filtering for purely residential use, they are not. That is the band where disaggregating pays off.
——-
Comparison with and overlaps with other exercises
In April 2026 the Ministry of Social Rights, Consumer Affairs and 2030 Agenda, together with the IFS-CSIC, published Un mercado dominado por multiarrendadores (Gil, Villas, García-Duch & Lebrusán, 2026). It is, to date, the work closest to ours. It coincides in the primary source (the IEF-AEAT Household Panel, 2023 tax year), in the unavoidable exclusion of the foral territories that comes with using the Panel, in the grossing-up with the INE Continuous Population Statistics, and in the unit of analysis: the household. Their analysis finds that 47.2% of the stock rented out by individuals is in households with a single rented home, and 52.8% in households with two or more. To do so they use the PAR150 variable (as documented in the report’s methodological note): the deduction for letting real estate used as a main residence, aggregating unique cadastral references for each household. Ángel Martínez Jorge replicated the analysis with results about 5 points away from those of Gil et al. and 5.6 points from the result we show above. In our view, these differences are within small orders of magnitude, attributable to methodological precision choices that do not change the overall picture, which coincides especially between the one shown here and the one produced by Martínez Jorge, based on what seems to us the most enriching way of approaching the analysis: disaggregating beyond “two or more” to see what that subgroup is made up of, in which these three exercises agree that half of the homes in residential rental owned by private individuals are found.
Because the Gil et al. report makes a choice about how to present the distribution which, perhaps, is the one that carries the greatest analytical and descriptive cost: the Ministry and CSIC report treats “two or more” as the only threshold. This prevents it from showing a granular and complete distribution. We choose to use only the Household Panel for clarity of categories, taking care to make explicit which part of the market this snapshot shows, and because this way we do show the distribution beyond this binary classification. As an accompanying description, we note the legal cut-offs in force: five homes in stressed areas, ten outside them (Law 12/2023).
There is another relevant distinction to be made. The headline of the Gil et al. report is “60% of the rental stock is in the hands of multi-landlords”, defined as holders with two or more rented homes. The jump in that figure compared with the previous ones is explained by the aggregation with legal entities and the public sector from sources outside the Household Panel. The 60% is not obtained solely from the block of private individuals. To construct it, the report adds to the “two or more” group the homes owned by private legal entities (Bank of Spain estimate, ≈8% of the private market) and those in public ownership (social housing stock).
It could be argued that a SOCIMI, a fund or public housing trivially meet the cut-off of two. However, it is worth asking about the analytical cost of putting in the same category (to give concrete examples) a SOCIMI with 200 flats, an investment fund, Madrid’s municipal housing company (EMVS) and a married couple with two inherited flats. Supply elasticity, the capacity to absorb a rent cap, professionalisation and the degree of penetration of rent default insurance are very different in each of these four profiles. Treating them as the same “large holder” erases precisely the distinction that matters for understanding market dynamics. In that sense, adding up for-profit companies (if granular data were available) would be more defensible on its own, as they correspond to operators perhaps more comparable to a household with several homes. This is a relevant line of work for the future.
Finally, it is worth adding that all these exercises are possible thanks to the IEF-AEAT-INE Household Panel, a statistical infrastructure that is rare in the European landscape: integrating income tax microdata with property files and family relationships at household level makes it possible to answer questions about the joint distribution of properties, uses and landlord composition that neither conventional surveys nor Cadastre or Bank of Spain aggregates can shed light on. The fact that different teams are arriving, with their own methodologies, at snapshots of residential rental is precisely a virtue of having a common resource to which each analysis contributes its own precision choices. The continuity of the Panel, the result of sustained collaboration between the Institute for Fiscal Studies and the Tax Agency together with the INE, and the progressive widening of access to it for the research community are key to ensuring that the public debate on housing can rely on granular evidence rather than broad categories.
—–
Heterogeneity across autonomous communities
The aggregate picture hides relevant differences between territories. The same dimensions observed so far deserve attention region by region: the weight of residential rentals in the non-main stock and the shape of the distribution by owner household, according to where these homes are located.

The weight of residential rentals in the non-main stock ranges from 9-14% in Extremadura, Castilla-La Mancha, Castilla y León and Andalusia to 43.8% in Madrid, followed by Catalonia (34.4%), the Balearic Islands and the Canary Islands (31.4%). The pattern is consistent with demographic pressure: where there is more urban demand, more non-main housing enters the residential market. The Balearic and Canary Islands stand out for a relatively high tourist weight, although it remains a minor fraction of the non-main stock, and they are not alone: Andalusia, Galicia, Catalonia and La Rioja are also there.
A note is needed on the categories “second home” and “third, empty or undeclared”, which with the Panel data cannot be told apart in their deeper nature and, above all, hide very heterogeneous realities depending on the territory. In Extremadura, Castilla-La Mancha or Castilla y León, that part of the non-main stock weighs heavily and probably reflects, to a large extent, inherited houses in villages whose owners no longer live there: housing with a low opportunity cost and little expectation of monetisation. In the Balearic Islands, the Canary Islands or Asturias the weight is also high, but its nature is presumably different: second homes of non-residents, homes for the owners’ own holiday use or lent to relatives in high-pressure areas, and in some cases undeclared tourist rentals. Catalonia combines both profiles depending on the county. The figure, with the information currently available, is the same; what lies beneath it is not.

The shape of the distribution is remarkably similar in most autonomous communities: a sharp fall from the single-home band towards the higher bands, with very few households with five or more. The two clear exceptions are the Balearic and Canary Islands, where the middle or upper band carries visibly more weight than the national average. In other words: even where concentration is higher, it is not due to a few large holders at the top, but to a slightly higher weight of households with several homes in the middle band.

A summary way of looking at the top of the distribution is to ask what fraction of the stock is in households with 5 or more residential homes let, further distinguishing between the intermediate band (5-9, in yellow) and the band at the double legal threshold (10 or more, in red, the default cut-off outside stressed areas). The 5+ total ranges from 7.8% in Cantabria to 19.4% in the Balearic Islands, with the national average at 13.7%. Above average: the Balearic Islands, the Canary Islands, Galicia, Catalonia, Asturias and Murcia. It is notable that Madrid (8.4%) is among the least concentrated despite being the autonomous community with the largest weight of residential rentals: more market, but more fragmented. The top band (10+) makes a comparatively small contribution, except in the Balearic Islands, where 10+ reaches 7.3% (the highest figure among autonomous communities) compared with 12.1% in 5-9 — the top band weighs more there than in any other territory.
It is worth stressing what that figure is not . The five-home threshold is a legal construct (chosen to define obligations under Law 12/2023), not an indicator of market power. The fact that 19.4% of the Balearic stock is in households with five or more homes does not imply that these households can set prices above the competitive level: individual shares remain tiny, large households are not coordinated, and the structure remains, in competition terms, broadly fragmented (with possible exceptions in specific areas where large owners might hold a significant volume of supply at the level of a neighbourhood or a small or medium-sized municipality; something the Household Panel does not allow us to discern).
Heterogeneity across cities
Moving down to municipal level, the picture becomes sharper. We work with a subgroup of 14 large cities (≥40,000 sample observations in the Panel) that includes the two large metropolitan areas and a set of medium-sized provincial capitals. Although the Household Panel does not guarantee statistical representativeness at this level, we believe the sample is large enough to at least offer a comparative order of magnitude.

The weight of residential rentals is highest in Barcelona (39.9%), Madrid (36.8%) and Palma (35.0%), followed by Zaragoza, Valencia, Gijón and Las Palmas (28-32%). It falls below 20% in Seville, Murcia and Cartagena. The fraction of the non-main stock that is empty or lent without a declared use is relatively high in all cities but clearly lower in some: notably, how little it represents in Madrid, Barcelona or Málaga, given how stressed their markets are.

The shape of the distribution is, once again, mostly the retail curve (a fall from a single home and very few households with five or more), with moderate deviations by city. Las Palmas and Murcia show a middle band (3-7 homes) above the national average. Madrid and Seville are slightly below it in that same band.

The summary of the top of the distribution by legal thresholds shows that Murcia (17.8%), Gijón (16.6%), Barcelona (16.5%) and Palma (16.4%) are the cities with the most stock in the hands of households with 5+ homes. Madrid (7.8%) and Seville (8.0%) are the least concentrated, clearly below the national average. Cross-referencing with the composition chart shows that a larger residential market does not imply greater concentration. Separating the two bands adds nuance: in Gijón and Murcia the weight of the top band (10+) is very low (1.1% and 2.7%), so their 5+ concentration is dominated by the intermediate band; in Palma, Málaga and Las Palmas the top 10+ band weighs more (5-6%), a sign of a somewhat more established fabric of large portfolios. And, once again, 5+ summarises the top of the distribution but does not measure market power: even in Murcia, the most concentrated city on the list, each household’s individual share of the municipal residential market is marginal.
Madrid and Barcelona: two profiles within the same pattern
The two big capitals deserve their own attention because of their weight in the market. They share the same general structure (a fall from a single home and few households with five or more) with two distinguishable profiles.

In Madrid 49% of the residential stock is in households with a single rented home, slightly above the national average. The weight of households with five or more homes (7.8%) is below the national aggregate. Among large cities, it is one of the most fragmented residential markets. In Barcelona the single-home band is considerably smaller (38.8%) and the bands of 2 to 4 homes weigh somewhat more than the national average. The stock in households with 5+ reaches 16.5%, above average. But the bulk remains concentrated in the lower band: around 75% of the residential stock is in households with four or fewer rented homes. The difference between the two capitals is not one of order of magnitude but of degree, within the same broadly retail pattern: in neither of them is there a market truly dominated by large holders.

In Madrid, the stock in the hands of households with just 1 home fell from 52.4% to 49% over these years: what rises above all is the presence of homes in households with 2-3-4 (suggesting accumulation by households that started with one: an investor who goes from small to less small, so to speak, or medium-sized) in a gentle but clear pattern.

In Barcelona the pattern is much more pronounced: the stock in households with a single rented home is no longer the majority, and in exchange all bands have risen: especially those with 3 and 4 homes, but also those with 8, 9, 10 and more. Barcelona’s dynamics therefore deserve special attention. But whether those dynamics matter for regulation and for wealth equity depends on which threshold is considered relevant.
In conclusion: the picture that emerges
The purpose of this text is to offer a rigorous and granular description of how the stock of residential rental housing owned by individuals is distributed and how it varies by territory, with the aim stated at the outset of shedding light on what broad categories tend to obscure. The picture that emerges has four features.
It is populated by relatively small owners. Residential rental owned by individuals in Spain is best defined as a market of many owners at the lower end of the distribution: 47% of the stock is in households with a single rented home, 59% of landlord households have no more than that, and only 13.7% of the stock (or 6.9% of households) exceeds the legal large-holder threshold in stressed areas (five homes). The ten-home threshold (the default cut-off outside stressed areas) is exceeded by only 3.6% of the stock and 1.2% of households.
It is less concentrated than aggregate views suggest. The concentration of the residential subset is lower than that of all properties let by those same households: filtering strictly for main-residence housing fragments the picture rather than concentrating it. The important analytical caveat lies in the middle band: that is where the two Lorenz curves diverge, identifying a segment of medium-sized landlords with portfolios of diversified uses (one or two residential homes plus several premises or storage rooms) who in aggregate look like large holders and, when filtered for purely residential use, are not. Small and large holders are almost equally concentrated under both measures; what changes with the filter is the middle.
It is stable across the country, but not in specific places. Between 2016 and 2023 the movements are at the lower end of the distribution and are consistent with a pattern of “those who had one have added one more”. The weight of households with many homes barely moves. The nuance, and not a minor one, lies in Madrid and especially in Barcelona: in both capitals the weight of the “single-home holder” falls, but much more so in the latter. In the Spanish capital it is the two-three-four band that increases most; in the Catalan capital, growth across the whole curve is greater and extends up to 10+.
It is heterogeneous by territory, but within the same general pattern. The concentration of the residential subset varies across autonomous communities (from 7.8% in Cantabria to 19.4% in the Balearic Islands) and across cities (from 7.8% in Madrid to 17.8% in Murcia), and the composition of the non-main stock changes a great deal depending on demographic pressure and the weight of tourism. But the shape of the distribution (a fall from the single-home band and very few households with five or more) is reproduced in almost all territories. The two big capitals show distinguishable profiles within this common pattern: Madrid somewhat more fragmented despite having the largest weight of residential rentals in the non-main stock; Barcelona with somewhat more weight in the middle band (2-4 homes) and 16.5% in households with 5+, above average. The clearest deviations from the national pattern appear in island territories (the Balearic and Canary Islands) and in some medium-sized cities, always due to a greater weight of the middle band, not to more households with many homes. These figures should also be read alongside the composition of the non-main stock: in stressed coastal and island areas (the Balearic Islands, the Canary Islands, Málaga, Palma; but also Barcelona) the fraction of the non-main stock that does not enter residential rental is high and, within it, the comparative weight of non-residential rentals, second homes of non-residents and holiday homes is notably greater than in inland Spain: there may be untapped scope for mobilising supply there. In none of the territories analysed does the distribution come close to a market dominated by large holders.
One final distinction matters for structuring the debate. Market power is one thing (the capacity of an agent to set prices above the competitive level) and it is quite another for ownership above a certain threshold to seem socially undesirable to us for distributive, fiscal or intergenerational equity reasons. Public discussion tends to mix them up, and it is best not to.
The way we understand concentration, and the thresholds beyond which it concerns us, are different in each case. For the market question, what matters is how many residential homes (current or potentially mobilisable for rental) a single owner controls in an area defined by equivalent demand; that threshold is hard to generalise and will depend on context, because demand is not uniform across territories or even within the same municipality. An aggregate figure such as 13.7% of the national stock in households with five or more homes says little about market power in a specific block in Palma or Barcelona, or about the effect of a single relatively large owner at the level of a neighbourhood or a small or medium-sized municipality. That said, the fact that a large city covering a relevant market area, such as Madrid, has a concentration of only 1.5% of homes owned by private long-term rental landlords in households with 10 or more homes does begin to indicate that these households have little market power. And, without being conclusive in the opposite direction, the fact that in Palma (a city a tenth the size of Madrid) this figure is four times higher at least suggests that some market dynamics might work differently there.
For the ownership question the logic is different, and the criterion for the point at which one threshold or another seems preferable depends on how much we want to redistribute existing property without forgetting that this will have associated costs. For example: discouraging the consolidation of a rental system with professional medium-sized landlords providing rental housing, able to absorb shocks (non-payment, vacancies), to offer a more professionalised service and, where appropriate, to bring economies of scale in management and maintenance. Neither model is objectively preferable: each is preferred for different reasons and produces different gains and losses.
In any case, this exercise does not seek to close this conversation, but to provide it with data so that it can take place on the basis of concrete evidence.
———
Methodological note. The analysis is based on microdata from the IEF-AEAT Household Panel, a longitudinal and cross-sectional sample produced jointly by the Institute for Fiscal Studies (IEF), the State Tax Administration Agency (AEAT) and the INE. The 2016 to 2023 tax years are used, integrating the modules on identification and socio-demographic characteristics, income, personal income tax, real estate and family relationships. Coverage is limited to the Common Tax Regime Territory; the Basque Country and Navarre fall outside the scope of the Panel because of their foral tax regime and, therefore, also outside the analysis.
The unit of analysis is the household, which is the natural unit for holding housing and wealth: it consolidates what two spouses or other members of the same household may hold separately. To avoid duplication, we check that cadastral references are not duplicated within the same household regardless of the ownership percentage declared by each member, and we apply the same criterion when computing the aggregate stock, even in cases of co-ownership between households: each cadastral reference counts only once in the household to which it is assigned, without being split through weightings by ownership percentage. Working at household level (1) avoids decisions that can affect the distribution more sensitively when working at individual level and (2) maintains a direct correspondence with the relevant economic notion: the consolidated portfolio of the family unit.
Owing to the nature of the database, the analysis is restricted to homes owned by individuals (not self-employed) declaring income from real estate capital through personal income tax, which excludes (in addition to the self-employed) legal entities (companies, funds, SOCIMIs and similar vehicles) and the public or social housing stock, whose combined weight is discussed in the body of the text using external sources (Bank of Spain and MIVAU).
On this sample, a property-level dataset is built by integrating all income tax records (income from real estate capital and capital gains/losses, asset by asset) with the various files of the real estate module, as well as with tenants’ main residences, census or tax residence files and family relationship files, which makes it possible to identify and consolidate unique cadastral references, each assigned to a single household.
Homes actually let are identified using the use/purpose variable in the income tax real estate records file, which classifies each cadastral reference according to the AEAT’s Form 100, and the PAR150 variable (the landlord’s application of the deduction for letting a main residence). This classification as a long-term let home is thoroughly refined with cross-referenced information from the other files of the real estate and family relationship modules:
Homes classified as let are required to show positive income from real estate capital and a tenant who is an individual and not a company. A floor area threshold is applied. The sample is restricted to homes of at least 40 m2. The 40 m² threshold is applied to the total floor area of the property, but a second threshold of 10 m² on the purely residential floor area is required at the same time. Properties where both floor areas are missing are kept in the sample, as their size cannot be observed and they cannot be safely discarded.
Excluded are properties used for economic activities, those forming part of whole-business leases, the owner’s main residences, those assigned to former partners without effective availability for the owner, those available to residents who are close relatives (no further than the fifth degree); and garages, storage rooms and other annexes when they are let together with a main cadastral reference. All cross-checks are carried out at cadastral reference level.
Those that meet the criteria listed above and are let but do not show a main-residence deduction and are not classified under the other letting criteria are categorised as “rental for other uses”.
In addition, the household’s second home is identified as the non-main property with the highest cadastral value within that household in each year, among those with active imputed income. A maximum of one second home per household is allowed. The remaining non-main properties that do not fall into the rental categories described above, do not constitute a second home, and are not let to legal entities or self-employed people, or used for economic activities or businesses, etc., fall under the category of “empty, third home or undeclared use”.
The aggregate of these four components (long-term rental – other uses – second home – third, empty or undeclared) constitutes the stock of non-main-use housing, which in our view is conceptually and analytically distinct from housing used for business or commercial purposes, or in the hands of a close relative.
In addition, we require fiscal consistency (that the properties classified as non-let and non-main impute real estate income in personal income tax because they are available to their owners and are not their main residence), which rules out properties with inconsistent or residual declarations.
The results broken down by autonomous community and by city reflect the physical location of the let property, not the owner’s tax residence. For the municipal breakdown we work with a subgroup of 14 cities with at least 40,000 sample observations of the subgroup of homes of interest in the Panel; although the Panel does not guarantee strict statistical representativeness at this level of disaggregation, the sample is large enough to offer a robust comparative order of magnitude between cities.
The author thanks Lucía Cobreros for comments on earlier drafts and Ángel Martínez Jorge for his willingness to compare methodologies. Both made this work considerably richer.

Related content